
Dashboard Overview
The Warren dashboard tracks portfolio metrics, market regime, and every running strategy, with a plain-language health verdict per bot and metrics that always state their own basis.
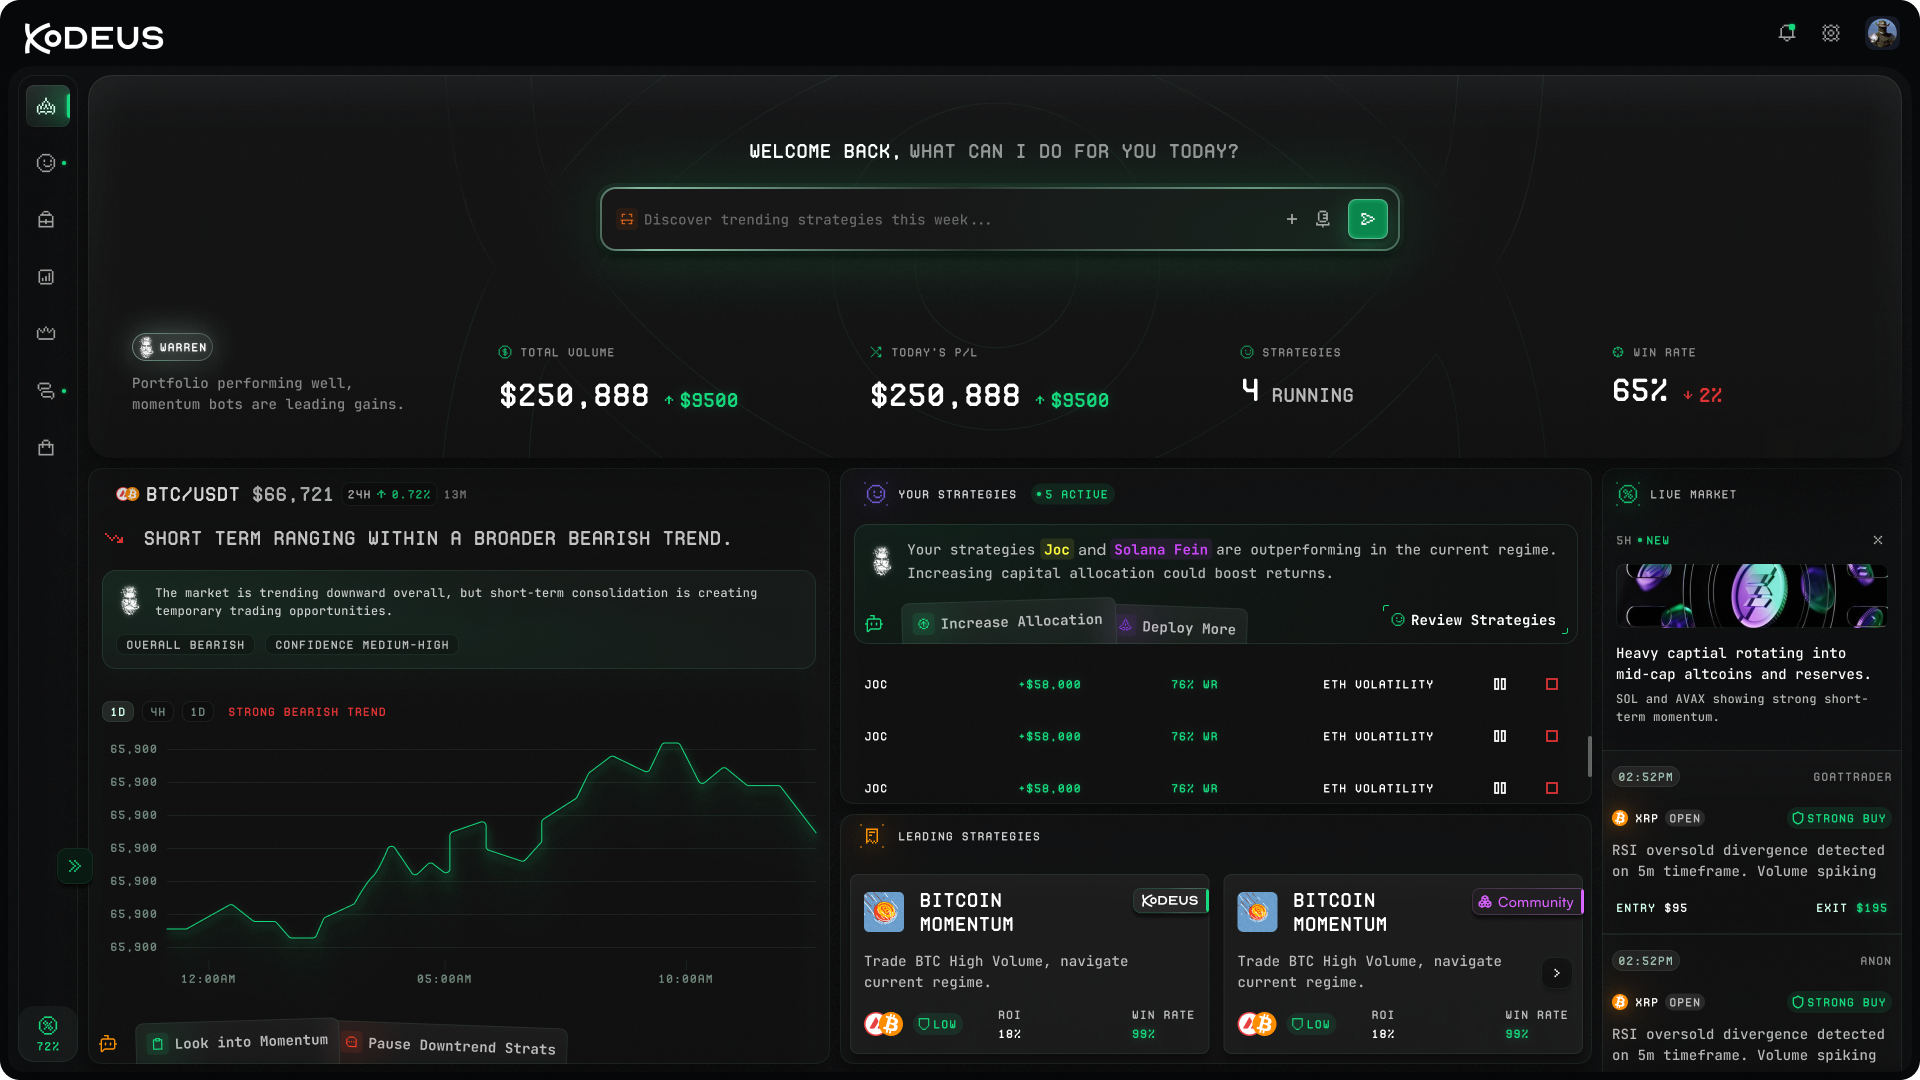
After activation, you are redirected to the Warren dashboard.
What the dashboard includes
- Portfolio metrics
- Market regime visibility
- Runtime strategy visibility
- Active strategy monitoring
- Performance tracking
- Strategy runtime state
- Conversational Warren access
Current dashboard signals
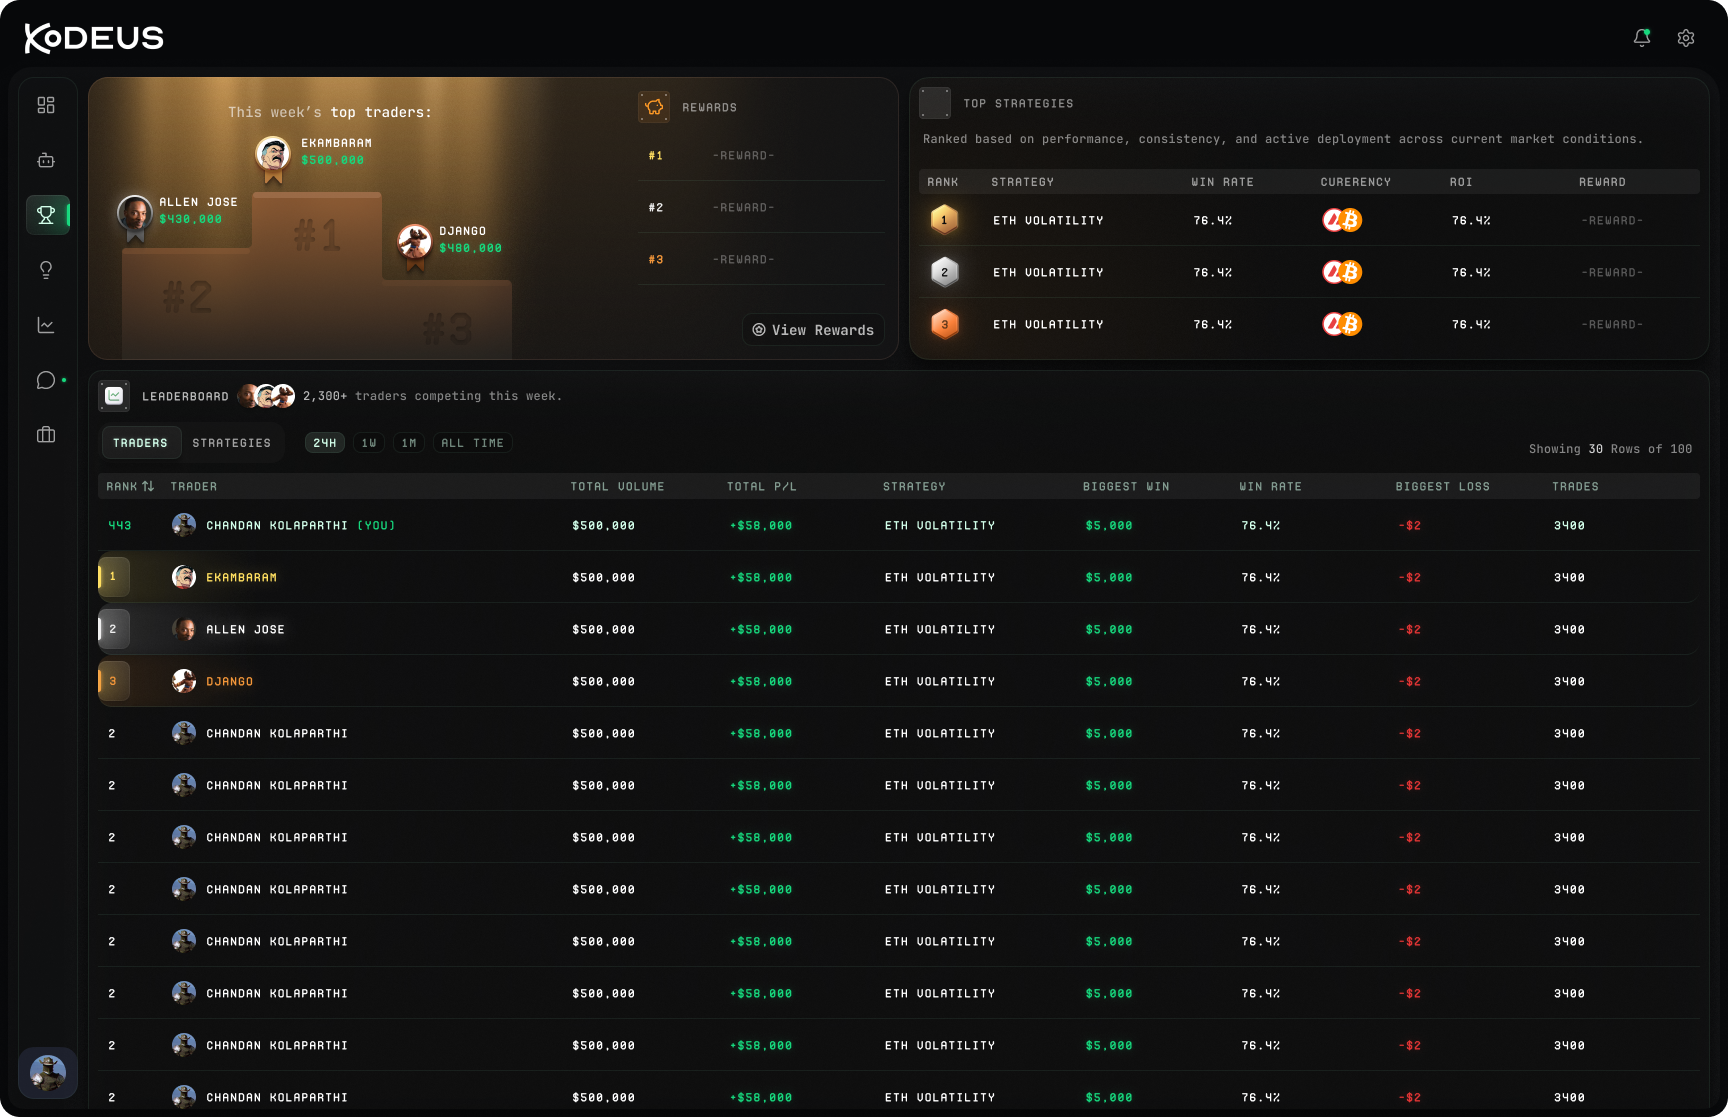
- Bullish or bearish market regime
- Multi-timeframe analysis
- Win rate tracking
- Strategy runtime visibility
- Live or paper strategy status
The dashboard is where you keep ongoing visibility into every strategy Warren is running and every signal it has detected.
The Trading Bay: every screen
The dashboard is the front door to the Trading Bay, the workspace where everything Warren can do is reachable. Chat drives it; the screens let you inspect and control it.
| Screen | What you do there |
|---|---|
| Portfolio | Your allocation across the three buckets, equity, active bots, recent trades, and headline ROI and win rate. |
| Warren, AI Fund Manager | The conversation. Market reads, strategy work, backtests, deployments, and every money-action confirmation happen here. |
| Live Strategies | Running and stopped bots. Per-bot detail: P&L, trade list, guards, and stop, resume, and reconfigure controls. |
| Strategies | Your library plus the preset catalog, per-strategy detail, versions, and backtest history. |
| Live Market | Market overview and regime views across the monitored universe. |
| Risk | Position-risk breakdown, exposure, leverage per position, and your account limits: Max Daily Loss, Max Drawdown, and Max Open Trades, with auto-stop on limit breach and risk alerts. |
| Marketplace | Browse, inspect, publish, and clone community strategies with verified track records. |
| Leaderboard | Ranked performance, built only from ranking-eligible results. Liquidated runs are excluded by the engine. |
| Alerts | Signal and system notifications, mirrored to Telegram if connected. |
| Schedules | Autopilot check-ins: create, edit, and review scheduled runs. |
Screen names may evolve with the app; the capabilities behind them are the stable contract.
Two parallel sets of numbers
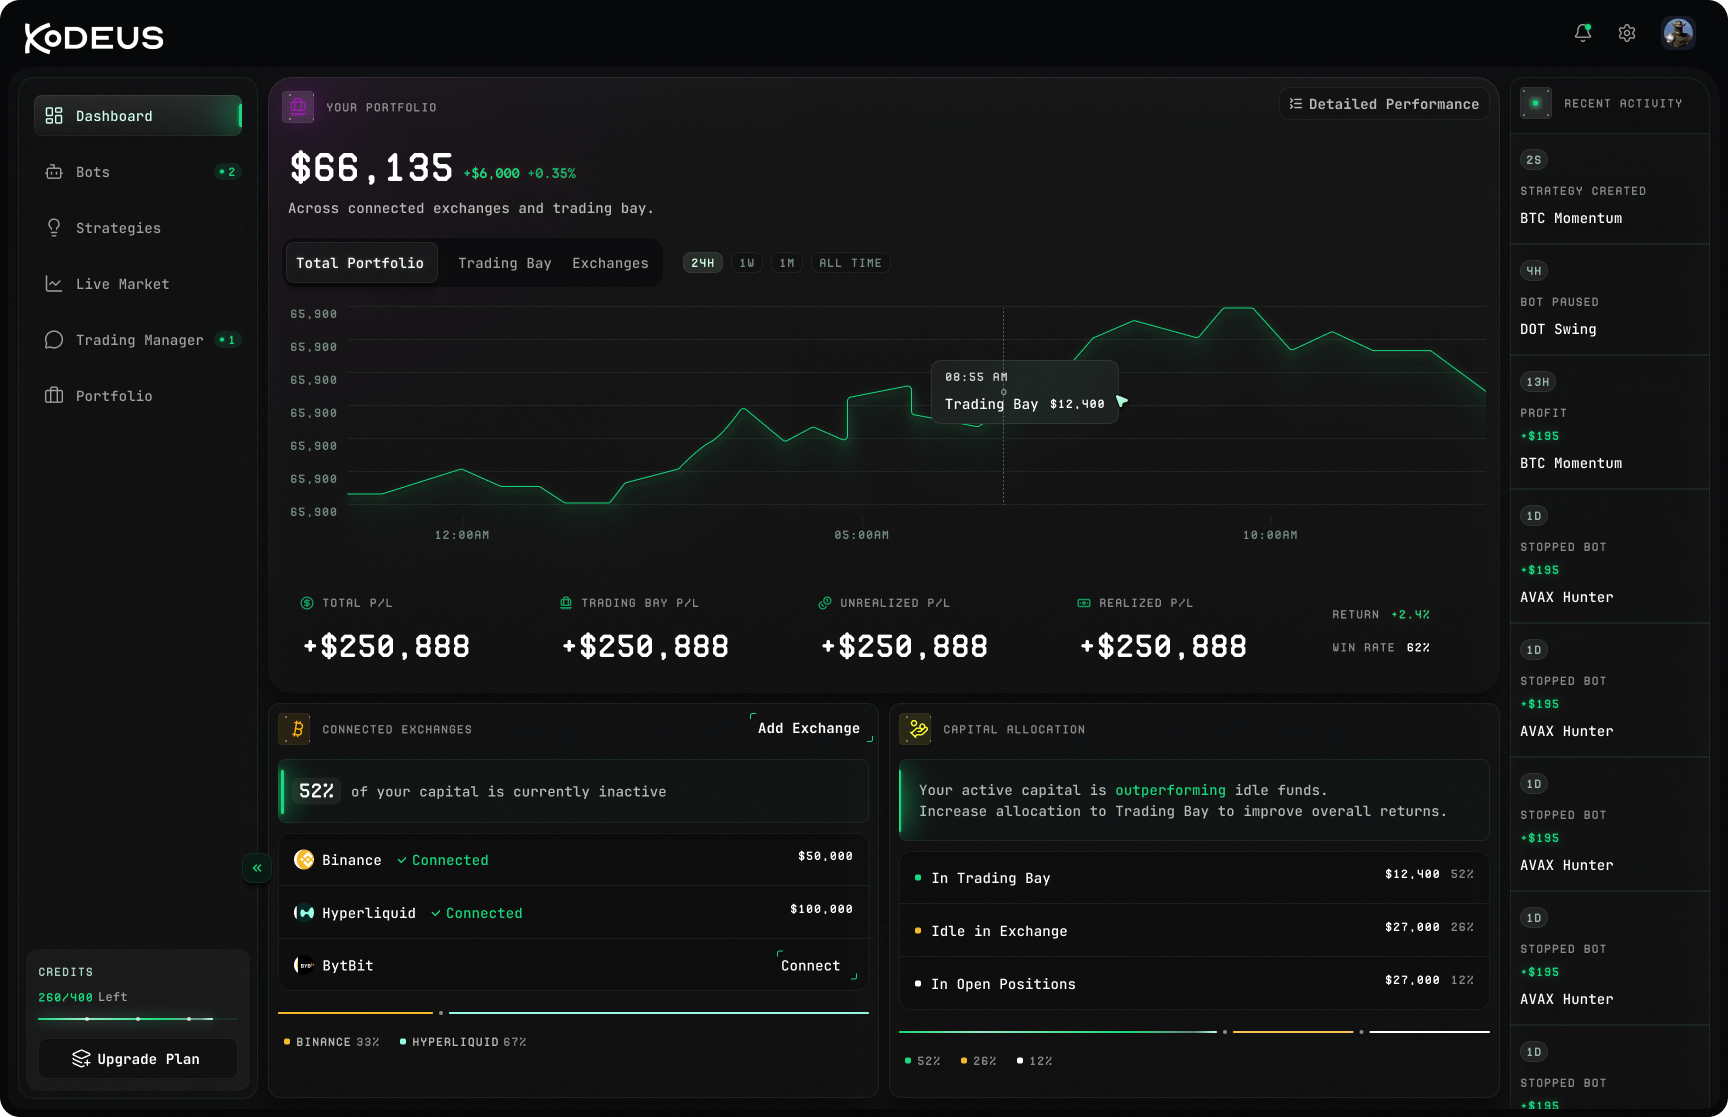
Because your strategy bots and Warren's own discretionary book are kept separate, every performance number comes in a matched pair, one for the bots, one for Warren's book, so the two never blur. For each you get aggregate P&L and win rate over 24h, 7d, 30d, and all-time; trade-by-trade history; and the worst peak-to-trough drawdown alongside the longest losing streak.
Per-bot health verdict
On top of the raw numbers sits a health check that reads each bot and returns a plain-language verdict rather than a smoothed score: "this bot is losing, and here is exactly why." You do not have to reverse-engineer a decline from a chart, the dashboard tells you what is happening and what triggered it.
Honest metric definitions. A number on the dashboard is never shown without its denominator. Strategy-bot return is capital-weighted, measured against the money that actually traded, not the configured budget. Drawdown is computed on cumulative realized P&L. Open positions surface their unrealized P&L separately from realized results. Each report states its own basis, so you always know what the figure is a percentage of.
Continue
How-To Guides
Recipes for market reads, deploying a paper bot, and watching the market while away.
FAQ
Why a bot stopped, why results differ live, and more.
Next: How-To Guides
Capital Allocation
Configure the exchange, pair, amount, and boundaries Warren trades within, backed by one shared capital pool that keeps your strategy bots and Warren's own book from ever double-spending the same funds.
Exchange Connectivity
Warren connects to seven venues through API-based authorization under a non-custodial model. Your funds stay on your exchange, your keys are encrypted to your identity, and leverage is capped in code.